Introduction
The Geophysical Monitoring Programs (GMP) group at LLNL generates global-scale tomographic images of the Earth's interior for the advancement of seismic event monitoring capabilities. The project is funded by the Ground-based Nuclear Detonation Detection (GNDD) program within the National Nuclear Security Administration (NNSA). The most recently released Earth models (LLNL-G3D series) and supporting software (LLNL-Earth3D) are available for download on this webpage.
The LLNL-G3Dv3 Model
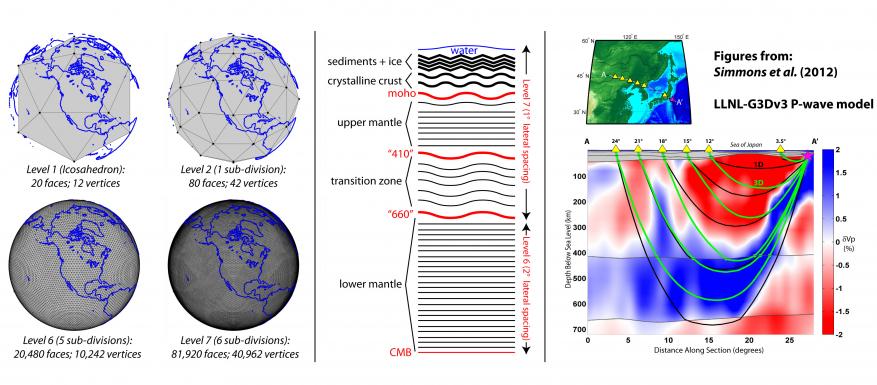
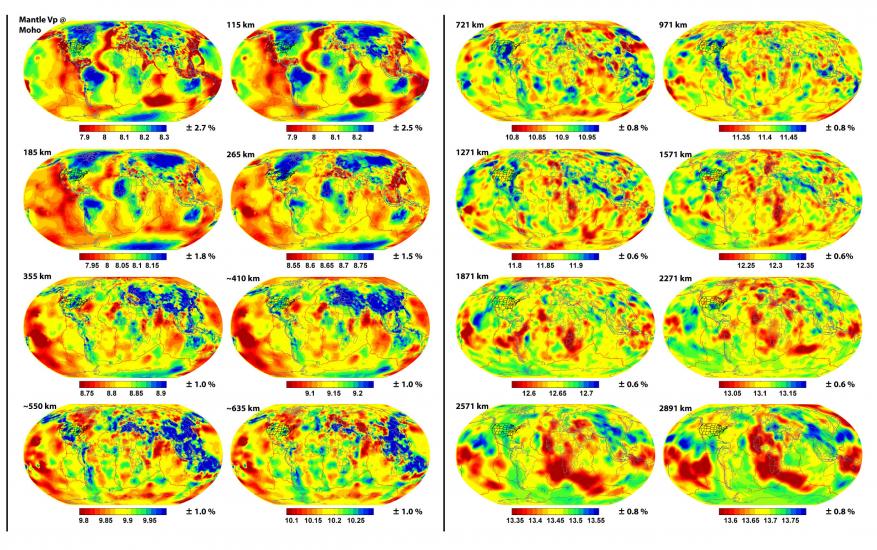
LLNL-G3Dv3 (Simmons et al. 2012) is a global-scale model of the crust and mantle P-wave velocity with regional-scale details. The model is parametrized using a spherical tessellation with node spacing of ~1 degree in the upper mantle and ~2 degrees in the lower mantle. Although a spherical tessellation was used to define the latitude and longitude positioning of nodes, the model itself is aspherical with Earth’s ellipticity, mantle stretching, and undulating discontinuities in the crust and upper mantle built-in. In total, the model consists of 57 layers from the surface to the core and ~1.6 million nodes. Three-dimensional ray tracing and a multi-scale imaging technique (Progressive Multilevel Tessellation Inversion or PMTI, Simmons et al. 2011) were employed to create the image. The model was developed using over 2.8 million groomed and reprocessed P and Pn travel times with events located using the Bayesloc global multiple event location technique (Myers et al. 2007, 2009, and 2011). Original data sources include the EHB Bulletin (Engdahl et al. 1998) provided by the International Seismological Centre (ISC), the National Earthquake Information Center (NEIC) bulletin, and a variety of regional bulletins. Arrival time measurements made by LLNL and other researchers augment bulletin data. Waveform data sources used in this study include seismic deployments for Peaceful Nuclear Explosions (PNE’s), large refraction surveys, the USArray Transportable Array (TA), and temporary Portable Array Seismic Studies of the Continental Lithosphere (PASSCAL) deployments around the world (Incorporated Research Institutions for Seismology or IRIS).
Downloads
LLNL-G3Dv3_Vp_Model.zip P-wave model published in Simmons et al. (2012). (Plain text files, 34 MB) LLNL-MI-586552
LLNL-G3Dv3.e3d.binary P-wave model published in Simmons et al. (2012). (Binary file version formatted for LLNL-Earth3D software, 85 MB) LLNL-MI-586552
The LLNL-G3D-JPS Model
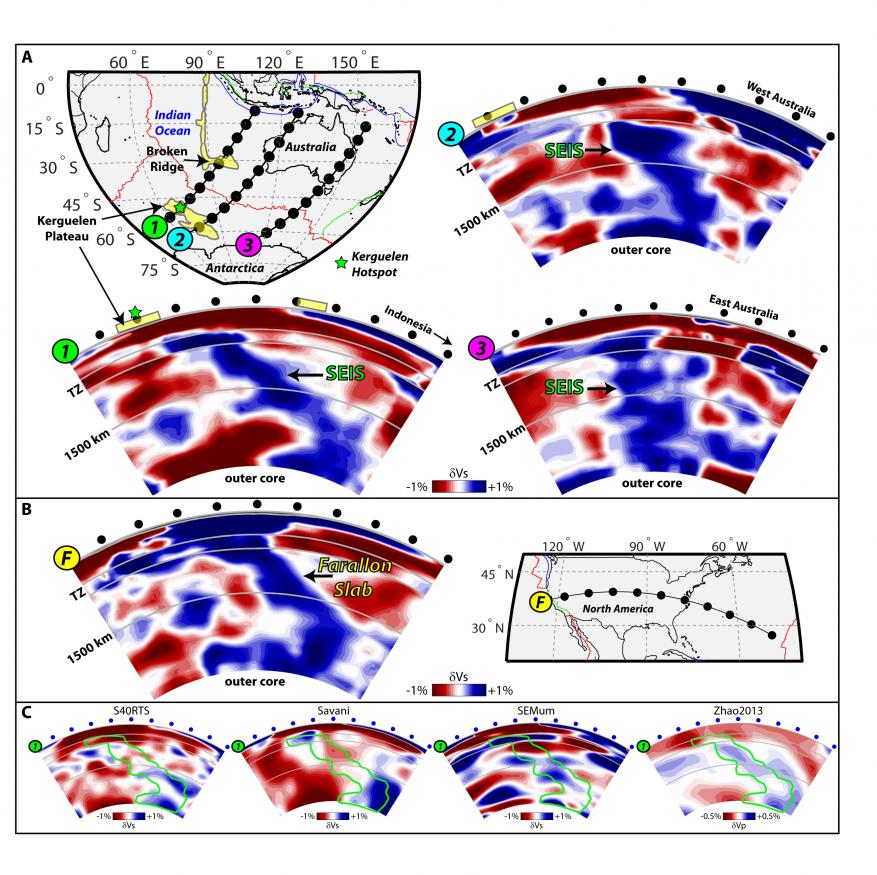
LLNL-G3D-JPS (Simmons et al., 2015) is a global-scale joint model of P- and S-wave velocities in the crust and mantle. The model architecture and methods are similar to the LLNL-G3Dv3 model above, with the exception that it is a joint inversion with P- and S-wave body wave travel times. Within this model, we discovered what we believe to be an ancient tectonic plate that may have sunk into the mantle beneath the southern Indian Ocean in the Jurassic Period (~140-200 million years ago). We named the anomaly the SouthEast Indian Slab (SEIS) (shown in the image below).
Downloads
LLNL_G3D_JPS.Interpolated.zip Joint P- and S- wave model published in Simmons et al. (2015). (Plain text files, 45 MB) LLNL-MI-659327
LLNL-G3D-JPS.e3d.binary Joint model published in Simmons et al. (2015). (Binary file version formatted for LLNL-Earth3D software, 140 MB) LLNL-MI-659327
Resolution and Covariance Matrices for the LLNL-G3D-JPS Model
In a study by Simmons et al. (2019), we constructed both the resolution and covariance matrices for the LLNL-G3D-JPS global joint model of P- and S-wave velocity (Simmons et al. 2015). The global model consists of >1 million free parameters, creating matrices with >1 trillion elements. Given the scale of the problem and computational limitations, we employed a custom method to calculated impulse responses at every node in the Earth model and produced sparse, yet representative, resolution and covariance matrices that can be practically employed for several real applications. See Simmons et al. (2019) for more details. Below are links to download the resolution and covariance matrices. The resolution matrix may be applied as a tomographic filter with a Python script written by Bernhard Schuberth. In addition, the LLNL-Earth3D software may be used to apply the model covariance matrix for path-specific travel time uncertainty calculations along with 3-D ray paths.
Resolution Matrix (part 1) Resolution kernel matrix from Simmons et al. (2019). (Plain text files with README file, 158 MB) LLNL-MI-736441
Resolution Matrix (part 2) Resolution kernel matrix from Simmons et al. (2019). (plain text files, 54 MB) LLNL-MI-736441
Tomographic Filter Code (LLNL_ToFi) Written and supplied by Bernhard Schuberth, LMU Munich. (Python)
Links to covariance matrix files will be added as they become available.
The LLNL-Earth3D Code for Extracting Model Parameters, Tracing Rays, and Computing Travel Times
Earth3D (or LLNL-Earth3D) is a java-based software package designed to facilitate the use of our global 3-D models, or other global models in the proper format. One of the primary functionalities of the code includes a custom-built 3-D ray tracing package for accurate travel time prediction. The 3-D ray tracing tool is multi-threaded allowing for more rapid calculation of 3-D paths and travel times by spreading the job across all available computer processors. The code can compute 3-D ray paths and multi-paths in complex media for a variety of common P- and S-wave phases (P, Pg, Pn, PcP, PP, pP, PmP, S, SS, ScS, SKS, sS, etc.) (Figure 4). There are other basic functionalities including tools to extract model parameters along vertical profiles or 2-D surfaces. Recently the functionality has been extended to compute path-dependent travel time uncertainty using model covariance matrices. In addition, surface wave dispersion may be computed at any point on the globe or averaged along 2-D sections between a source and a receiver (requires third-party add-ons).
LLNL-Earth3D (version 5.4.3+) User Manual
Nathan Simmons, Doug Knapp, Eric Matzel, Steve Myers
Lawrence Livermore National Laboratory
LLNL-SM-652345 (Revised August 29, 2018)Table of Contents
- Introduction
- General Background
- References
- Getting Started
- Ray tracing
- Ray tracing input options
- Ray tracing output options
- Examples
- Querying a model
- General queries
- Profiles and cross sections
- Map output
- Model importation
- Covariance matrices and uncertainty
- Surface wave dispersion curves
Downloads
LLNL-Earth3D Java-based code package for 3-D ray tracing through the LLNL-G3D binary models. (.jar, 73 MB) CODE-644272
LLNL-Earth3D-Manual User manual with examples (.pdf) LLNL-SM-652345
Contacts
- Nathan A. Simmons, simmons27 [at] LLNL.gov (simmons27[at]LLNL[dot]gov)
- Stephen C. Myers, myers30 [at] LLNL.gov (myers30[at]LLNL[dot]gov)
- Eric Matzel, matzel1 [at] LLNL.gov (matzel1[at]LLNL[dot]gov)
- Doug Knapp, knapp22 [at] LLNL.gov (knapp22[at]LLNL[dot]gov)
- Bernhard Schuberth, bernhard.schuberth [at] lmu.de (bernhard[dot]schuberth[at]lmu[dot]de)
References
Simmons, N.A., B.S.A. Schuberth, S.C. Myers, and D.R. Knapp (2019). "Resolution and Covariance of the LLNL-G3D-JPS Global Seismic Tomography Model: Applications to Travel Time Uncertainty and Tomographic Filtering of Geodynamic Models," Geophys. J. Int., 217(3), doi:10.1093/gji/ggz102
Simmons, N.A., S.C. Myers, G. Johannesson, E. Matzel, and S.P. Grand (2015). "Evidence for long-lived subduction of an ancient tectonic plate beneath the southern Indian Ocean," Geophys. Res. Lett., 42, doi:10.1002/2015GL066237.
Myers, S.C., N.A. Simmons, G. Johannesson, and E. Matzel (2015). "Improved regional and teleseismic P-wave travel-time prediction and event location using a global3D velocity model," Bull. Seis. Soc. America, 105(3), doi:10.1785/0120140272.
Simmons, N.A., S.C. Myers, G. Johannesson, and E. Matzel (2012). "LLNL-G3Dv3: Global P-wave tomography model for improved regional and teleseismic travel time prediction," J. Geophys. Res., 117, doi:10.1029/2012JB009525.
Myers, S.C., G. Johannesson, and N.A. Simmons (2011). "Global-scale P-wave tomography optimized for prediction of teleseismic and regional travel times for Middle East events: 1. Data set Development," J. Geophys. Res., 116, B04304, doi:10.1029/2010JB007967.
Simmons, N.A, S.C. Myers, and G. Johannesson (2011). "Global-scale P-wave tomography optimized for prediction of teleseismic and regional travel times for Middle East events: 2. Tomographic inversion," J. Geophys. Res., 116, B04305, doi:10.1029/2010JB007969.
Simmons, N.A., A.M. Forte, L. Boschi, and S.P. Grand (2010). "GyPSuM: A joint tomographic model of mantle density and seismic wave speeds," J. Geophys. Res., Vol. 115, B12310, doi:10.1029/2010JB007631.
Myers, S. C., G. Johannesson and W. Hanley (2009). "Incorporation of probabilistic seismic phase labels into a Bayesian multiple-event seismic locator," Geophys. J. Int., 177 193-204, doi:10.1111/j.1365-246X.2008.04070.x
Myers, S. C., G. Johannesson and W. Hanley (2007). "A Bayesian hierarchical method for multiple-event seismic location," Geophys. J. Int., doi:10.1111/j.1365-246X.2007.03555.x.
This work performed under the auspices of the U.S. Department of Energy by Lawrence Livermore National Laboratory under Contract DE-AC52-07NA27344. Web content release number LLNL-MI-652664.


