Wind Farm Modeling
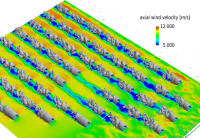
LLNL is developing simulation capabilities to model entire wind farms, including turbine arrays with control inputs, turbine wake effects, terrain, and realistic atmospheric inflow. These simulations will provide developers with the tools needed to plan and optimize existing and new wind farms to generate more power and reduce loads.
Complex Terrain Analysis
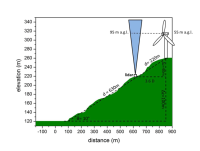
Wind turbines are often sited along the crest of hills or ridgelines to take advantage of terrain enhanced flows. While complex terrain can favor increased wind speeds, it also can cause uncertainty in the expected wind field as the wind profile no longer follows the classical logarithmic wind speed profile. LLNL has performed extensive field observation and simulation of boundary layer winds in complex terrain to help elucidate the effects of terrain on wind farm performance.
Multi-Scale Forecasting
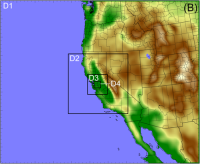
Mesoscale-microscale coupling is the key technology to replace the idealizations and simplifications limiting current microscale simulation tools with atmospheric, environmental, and topographic forcing obtained from mesoscale simulations. Current research at LLNL is focused on the development of physical process modules for seamless simulation across scales. These include robust methods to rapidly initiate turbulence at the inflows of turbulence resolving microscale domains, improved representation of boundary-layer structure on high-resolution mesoscale domains feeding microscale simulations, improved turbulence subgrid models for microscale simulation, and higher-fidelity surface-layer parameterizations appropriate for both high-resolution mesoscale and microscale simulations.
Atmospheric Turbulence
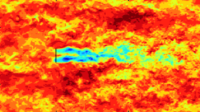
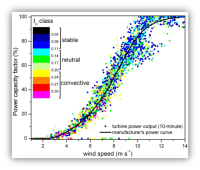
Recent studies have shown that turbine power production depends on a variety of factors, including the thermodynamic stability of the atmosphere, turbulence, and the entire wind speed profile intercepted by the turbine blades. Wharton and Lundquist (2012) showed that the average power produced by a wind turbine at a West Coast wind farm differed by as much as 20% according to the stability and turbulence present in the atmosphere. This difference in power production is important for utility operators, who must decide which combination of energy sources will best meet consumer demand at a given time. LLNL has undertaken many studies to both measure and model turbulent wind flow in the boundary layer. Measurement campaigns often involve multiple lidar and other instruments for comprehensive data collection. Modeling studies have focused on selecting the most accurate methods to develop realistic turbulence in WRF simulations using LES turbulence models.
Statistical Power Modeling
Wind power forecasting involves converting atmospheric forecasts into a forecast of power output from an individual turbine or many turbines in a wind farm. Traditional manufacturer-supplied power curves model power as a function of the wind speed at the hub height of the turbine. In reality, power output is a function of many additional variables. For example, wind speed at heights below and above the hub, air density, wind shear, and turbulence are also strong predictors of power production. Accounting for them provides a more complete power curve model. We compare lidar atmospheric data collected at wind farms with SCADA power-output data from wind turbines to gain a detailed understanding of the sensitivity of power output to changes in atmospheric conditions. We have investigated various statistical approaches for modeling power as a function of changes in atmospheric conditions and found them to be significantly better than that of manufacturers’ power curves, improving power predictions up to 10% more accurately.
Ensemble Forecasting
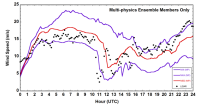
A comparison of different ensemble forecast methodologies for short-range prediction of wind ramp events using the Weather Research and Forecast (WRF) model was undertaken. We performed wind ramp forecasts using both a multi-analysis and a multi-physics ensemble philosophy at two study sites with different terrain complexity. The multi-analysis and the multi-physics ensemble forecast strategies are shown to have a high rate of wind ramp detection at both the flat and complex terrain sites. Results indicate the multi-analysis ensemble approach is able to forecast wind ramps more accurately at the flat terrain study site while the multi-physics performs slightly better at the complex terrain site. Both ensemble forecast methods tend to systematically predict the onset of wind ramp events too early at both study sites. However, the ensemble methods perform better at timing the end of a ramp event. The two ensemble types have similar skill in terms of predicting the magnitude of change in power generation associated with the ramp events. At the flat terrain site, the power generation magnitude error tended to be smaller than at the complex terrain site using either ensemble approach. While there was virtually no bias in generation magnitude prediction at the flat site, there was a slight tendency to over-predict the magnitude (by up to 7% of the capacity) at the complex site. An analysis of the model forecast results indicates both the multi-analysis and the multi-physics ensemble methodologies are reasonable approaches for wind ramp events in the context of short-range forecasting.
High Resolution WRF with IBM
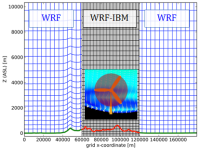
Mesoscale models, such as WRF, are typically used with horizontal grid spacing of 1 km or larger; however, LLNL developments are enabling the use of WRF at finer resolutions. At resolutions below 1 km, numerical errors arise in regions of complex terrain due to grid skewness of the terrain-following coordinate. These numerical errors significantly decrease the fidelity of the solution. Therefore, simply increasing the model resolution does not necessarily lead to more accuracy. An alternative approach, known as the immersed boundary method (IBM), eliminates the terrain-following coordinate and the associated errors. LLNL has implemented IBM in the WRF model, and shown that it alleviates errors caused by terrain-following coordinates, and extends the applicability of the WRF model to very high-resolution simulations (to grid spacings of 1 m). LLNL validated WRF-IBM for stand-alone microscale simulations (i.e. used as a “typical CFD” model at meter resolution). WRF-IBM is currently being extended to handle complex terrain at wind farm scales, and being developed for true multi-scale simulation capabilities. WRF-IBM allows for more accurate wind simulations in complex terrain, ranging from the regional to the turbine scale, which leads to improved forecasting and wind turbine siting at the wind-farm scale
Grid Integration of Renewables
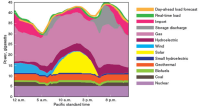
In 2011, the California Energy Commission funded research at Lawrence Livermore to determine whether new energy storage technologies and demand response initiatives might help balance the load on generators as more solar and wind resources are added to the grid. Energy storage systems allow grid operators to more effectively manage the power supply when demand is high but wind and solar resources are not generating much electricity. Demand response initiatives offer customers financial incentives to reduce or shift their electricity usage when there is a shortage of power generated. For this project, we combined atmospheric forecasting, scheduling optimization, and production simulation to create a comprehensive planning system for electric grid research. By tapping the Laboratory’s supercomputing resources to run thousands of simulations, the researchers determined the value of using increased storage and demand response initiatives to keep California’s complex grid system operating affordably and reliably. Results from the study indicate that California’s electric grid can accommodate a large increase in capacity from renewables, even if energy storage is not widely deployed. The data should also help policy makers determine the best path for achieving the state’s RPS goals. The Livermore project is the first to combine physics-based uncertainty modeling of renewable generation with stochastic planning methods to simulate the operation of a highly renewable system. Modeling a full year of system behavior and accounting for forecasting and energy production uncertainty compounded the project’s complexity, but it provided more confidence in the resulting data. Another significant outcome of the project is that it demonstrated the value of ensemble modeling for optimizing complex operations. Running the California electric grid with 33 percent renewable generation introduces a great deal of uncertainty that needs to be managed effectively. More sophisticated methods for measuring and incorporating uncertainty will improve the system’s efficiency and reliability.”
WindSENSE Data Mining
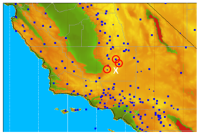
As the percentage of wind energy contributing to the power grid continues to increase, the variable nature of wind can make it difficult to keep the generation and the load balanced. But recent work by Lawrence Livermore National Laboratory, in conjunction with AWS Truepower, will help this balance through a project that alerts control room operators of wind conditions and energy forecasts so they can make well-informed scheduling decisions. This is especially important during extreme events, such as ramps, when there is a sharp increase or decrease in the wind speed over a short period of time, which leads to a large rise or fall in the amount of power generated. One of our goals is to help the people in the control room at the utilities determine when ramp events may occur and how that will affect the power generation from a particular wind farm. The project, dubbed WindSENSE, was funded by the Department of Energy's Office of Energy Efficiency and Renewable Energy. To understand ramp events better, we used data-mining techniques to determine if weather conditions in wind farm regions can be effective indicators of days when ramp events are likely to occur. We used wind energy and weather data from two regions -- the Tehachapi Pass in Southern California and the Columbia Basin region on the Oregon-Washington border. The work identified important weather variables associated with ramp events. The observation targeting research conducted as part of the WindSENSE project resulted in the development and testing of algorithms to provide guidance on where to gather data to improve wind forecast performance. These new software tools have the potential to help forecast providers and users make informed decisions and maximize their weather sensor deployment investment. Part of the WindSENSE effort was to identify the locations and the types of sensors that can most improve short-term and extreme-event forecasts. The team used an Ensemble Sensitivity Analysis approach to identify these locations and variables. We are trying to reduce the barriers to integrating wind energy on the grid by analyzing historical data and identifying the new data we should collect so we can improve the decision making by the control room operators. Our work is leading to a better understanding of the characteristics and the predictability of the variability associated with wind generation resources.

